|
|
|
|
|
|
|
Details
of the PHRINGE Analysis Pipeline |
|
|
|
|
|
|
|
|
|
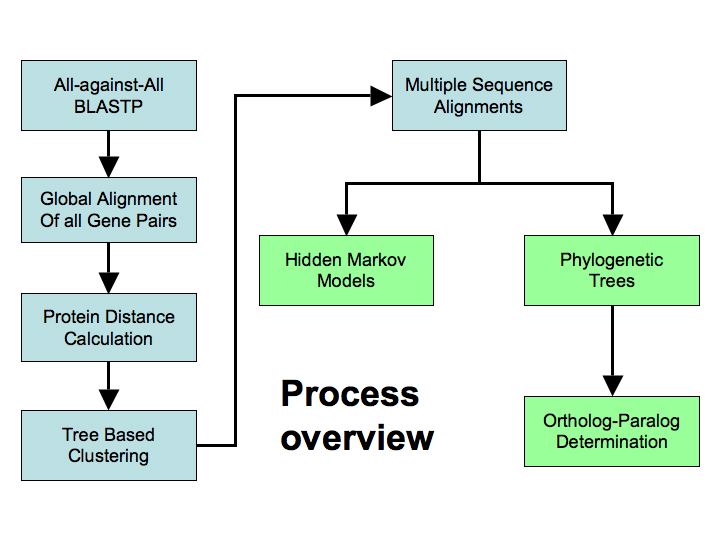
The
PHRINGE pipeline has five stages: (1) an all-against-all BLASTP
of the complete proteomes and selection of high-scoring pairs;
(2) full length alignment of all similar pairs of genes followed
by calculation of their distance; (3) iterative, hierarchical
clustering that respects the evolutionary relationships among
the organisms; (4) multiple sequence alignment for all genes
in each cluster; and (5) constructing evolutionary trees of
each cluster and determining orthologous / paralogous relationships
among the genes in each cluster.
These are described
in more detail below.
Back to the
PHRINGE Summary Page |
|
|
|
|
|
|
|
|
|
|
|
|
|
|
|
|
|
|
|
|
|
|
|
|
(1)
Inferred amino acid sequences of all gene models of all considered
genomes are entered into an all-against-all search using BLASTP
in order to identify similar sets of genes. |
|
|
|
|
|
|
|
(2)
Each BLASTP alignment reports only portions of the amino acid
sequences that are highly similar, so we now create full-length
alignments for each similar protein pair, followed by a calculation
of the distance between each pair using a substitution matrix. |
|
|
|
|
|
|
|
|
|
|
|
|
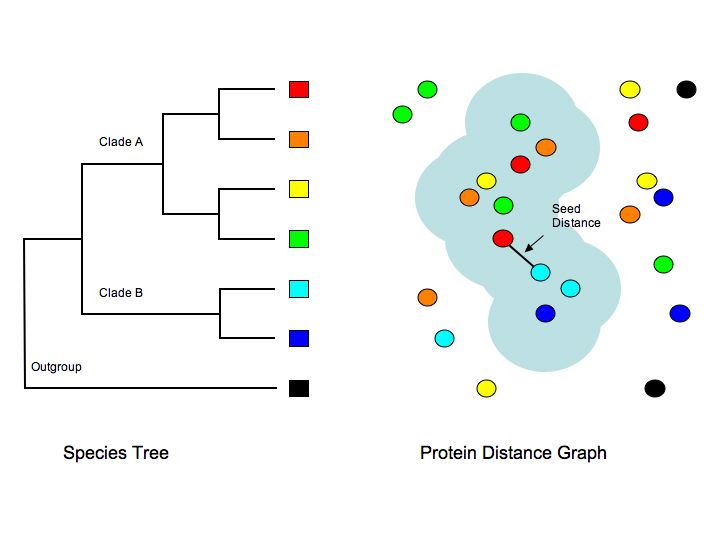
(3)
The tree shown on the right indicates the evolutionary relationships
among several hypothetical organisms, four from Clade A, two
from Clade B, and one that is an outgroup. The right side
of the figure illustrates a protein distance graph with circles
representing proteins colored to conform to each organism,
with the spatial distance of the circles proportional to their
sequence distance. Clusters are created by identifying a pair
of sequences (a seed) that is the shortest distance from any
Clade A protein to any Clade B protein. The cluster is then
grown by adding all proteins that have a shorter distance
than the seed until no additions can be made. The blue cloud
represents a cluster. The clustering is hierarchical, starting
at the base of the tree of the organisms and working iteratively
toward the tips, each time considering the genes on each side
of the ingroup-outgroup split. By doing so, we place genes
in the most basal clusters to which they can be traced, but
also use the increased accuracy of analysis possible when
considering only the more similar sets of genes.
|
|
|
|
|
|
|
|
|
|
|
|
|
|
|
|
|
|
|
|
|
|
|
|
|
|
|
| |
|
|
|
|
|
|
|
|
|
|
|
|
|
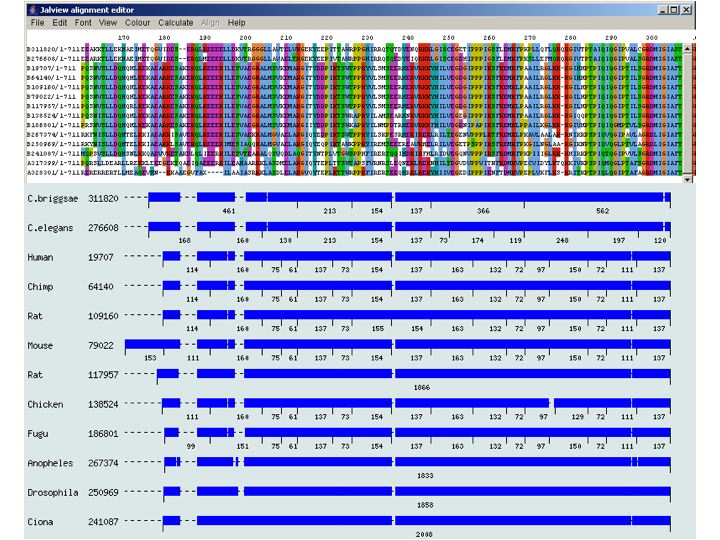
(4) A multiple sequence alignment
is created for each cluster. This, as well as the comparative
exon-intron structure are presented.
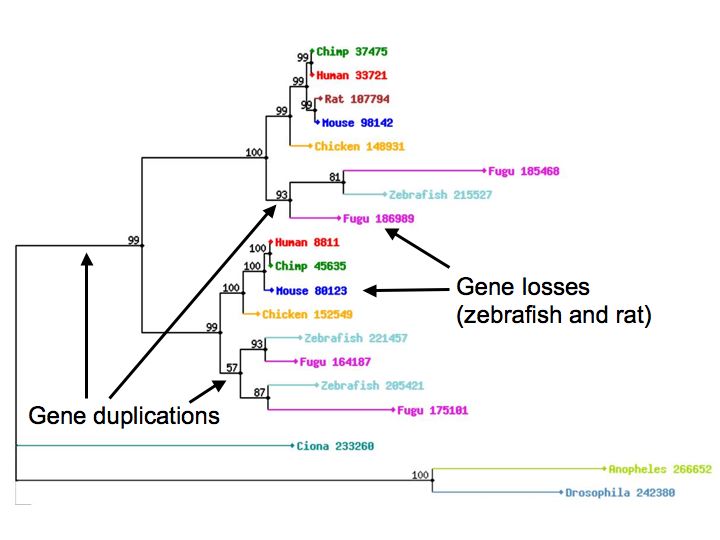
(5) Evolutionary
trees are created using real phylogenetic methods, rather
than just using the error-prone sequence similarity methods
in common use.
|
|
|
|
|
|
|
|
|
|
|
|
|
|
| |
|
| |
|
| |
|
| |
|
| |
|
|
|
|
|
|
|
|
The gene tree is reconciled
with the known relationships of the organisms to determine,
relative to lineage splitting, when each duplication or
loss occurred, and so to infer the orthologous and paralogous
relationships among the genes.
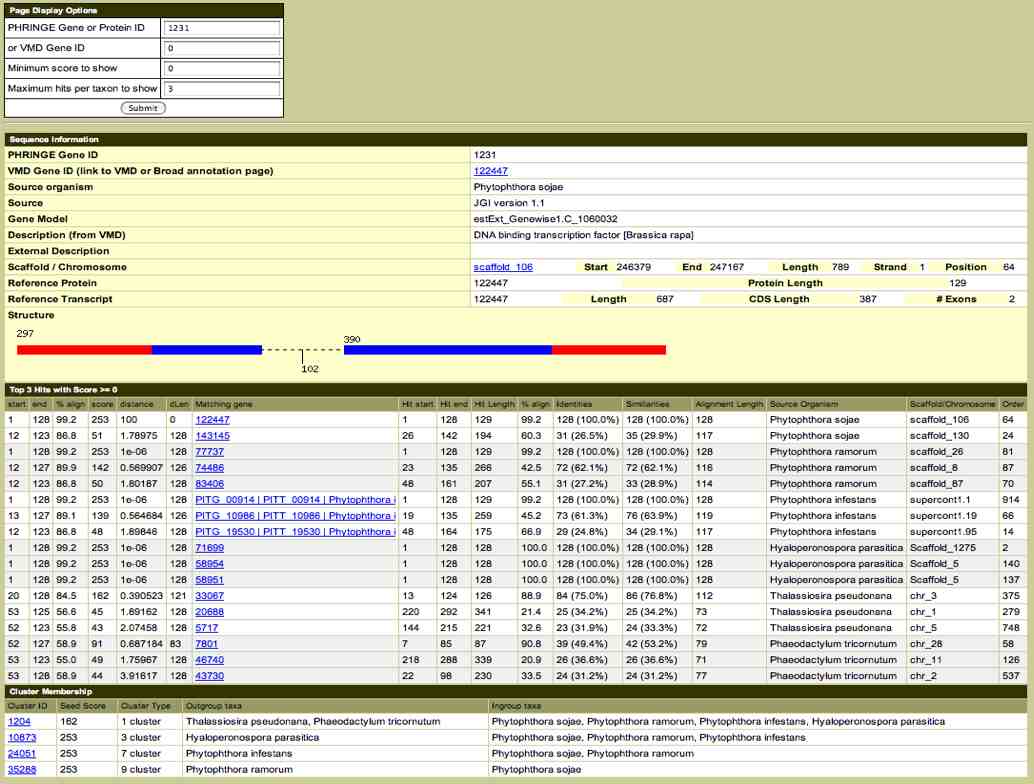
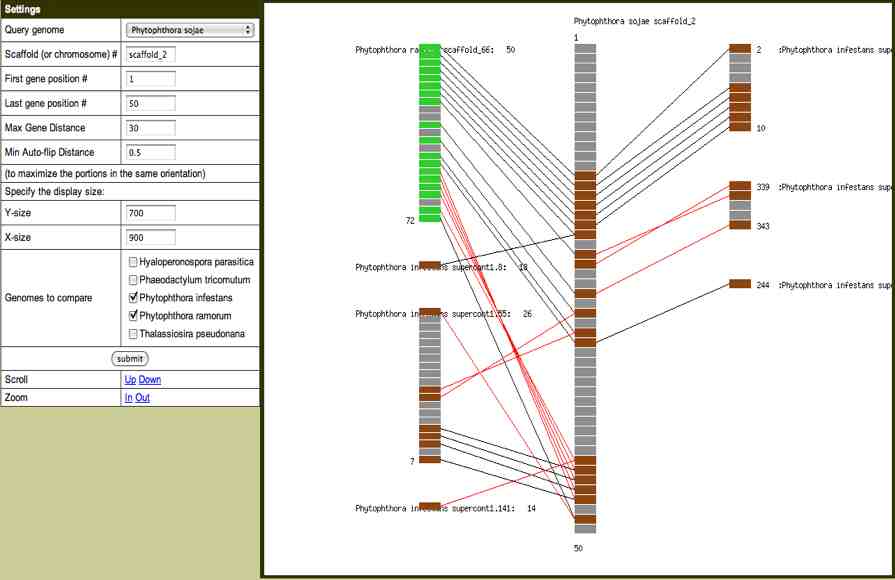
We make extensive
linking to functional genomics databases (below) and provide
input into the Synteny Viewer (below right) where users can
compare the physical relationships of genes identified as
homologs among genomes.
|
|
|
|
|
|
|
|
|
|
|
|
| |
|
| |
|
| |
|
| |
|
| |
|
| |
|
| |
|
|
|
|
| |
|
|
|
| |
 |
|
|
| |
|
|
|
| |
|
|
|
| |
|
 |
|
| |
|
|
| |
|
|
| |
|
|
| |
|
|
| |
|
|
| |
|
|
| |
|
|
| |
|
|
| |
|
|
| |
|
|
| |
|
|
| |
|
|
| |
|
|
| |
|
|
| |
|
|
| |
|
|
| |
|
|
| |
|
|
|
|